Bundle Browser
LASSO-ENA Bundle Browser website: https://lasso-ena.arm.gov
The LASSO-ENA Bundle Browser is the web interface for reviewing and requesting downloads of LASSO-ENA simulation data. While tailored specifically to the type of simulations produced for ENA, the LASSO-ENA browser is similar to the bundle browsers for the SGP shallow-convection and CACTI deep-convection LASSO scenarios. The browser provides summary plots and animations showing related observations for each case date, comparisons of each simulation with the observations via plots and skill scores, and the ability to order simulation files for downloading. The browser is organized into four primary sections, described below:
The home page with an overview of LASSO-ENA and a table of case dates
Observation summary pages for each case date
Simulations for each case date
Ordering infrastructure
Browser Home Page
The browser home page is the default, top-level page when accessing https://lasso-ena.arm.gov. Users can also return to the home page by clicking the “Home” button in the icon bar on the top of each browser page. The top of the page gives an overview of LASSO-ENA along with links to find additional information. The lower portion of the page contains a table of case dates with links to access data for each date. Clicking on the “view” links in the table brings one to the respective observation and simulation pages for the respective date.
At present, an ARM user account is necessary to access content within the LASSO browsers. This account is free and available to anyone who requests one. If you do not already have an ARM account, select the Create an ARM Account link shown then first going to the browser website. The account will be used to assist with staging file orders, contacting users regarding order status, and udpates related to their prior downloads.
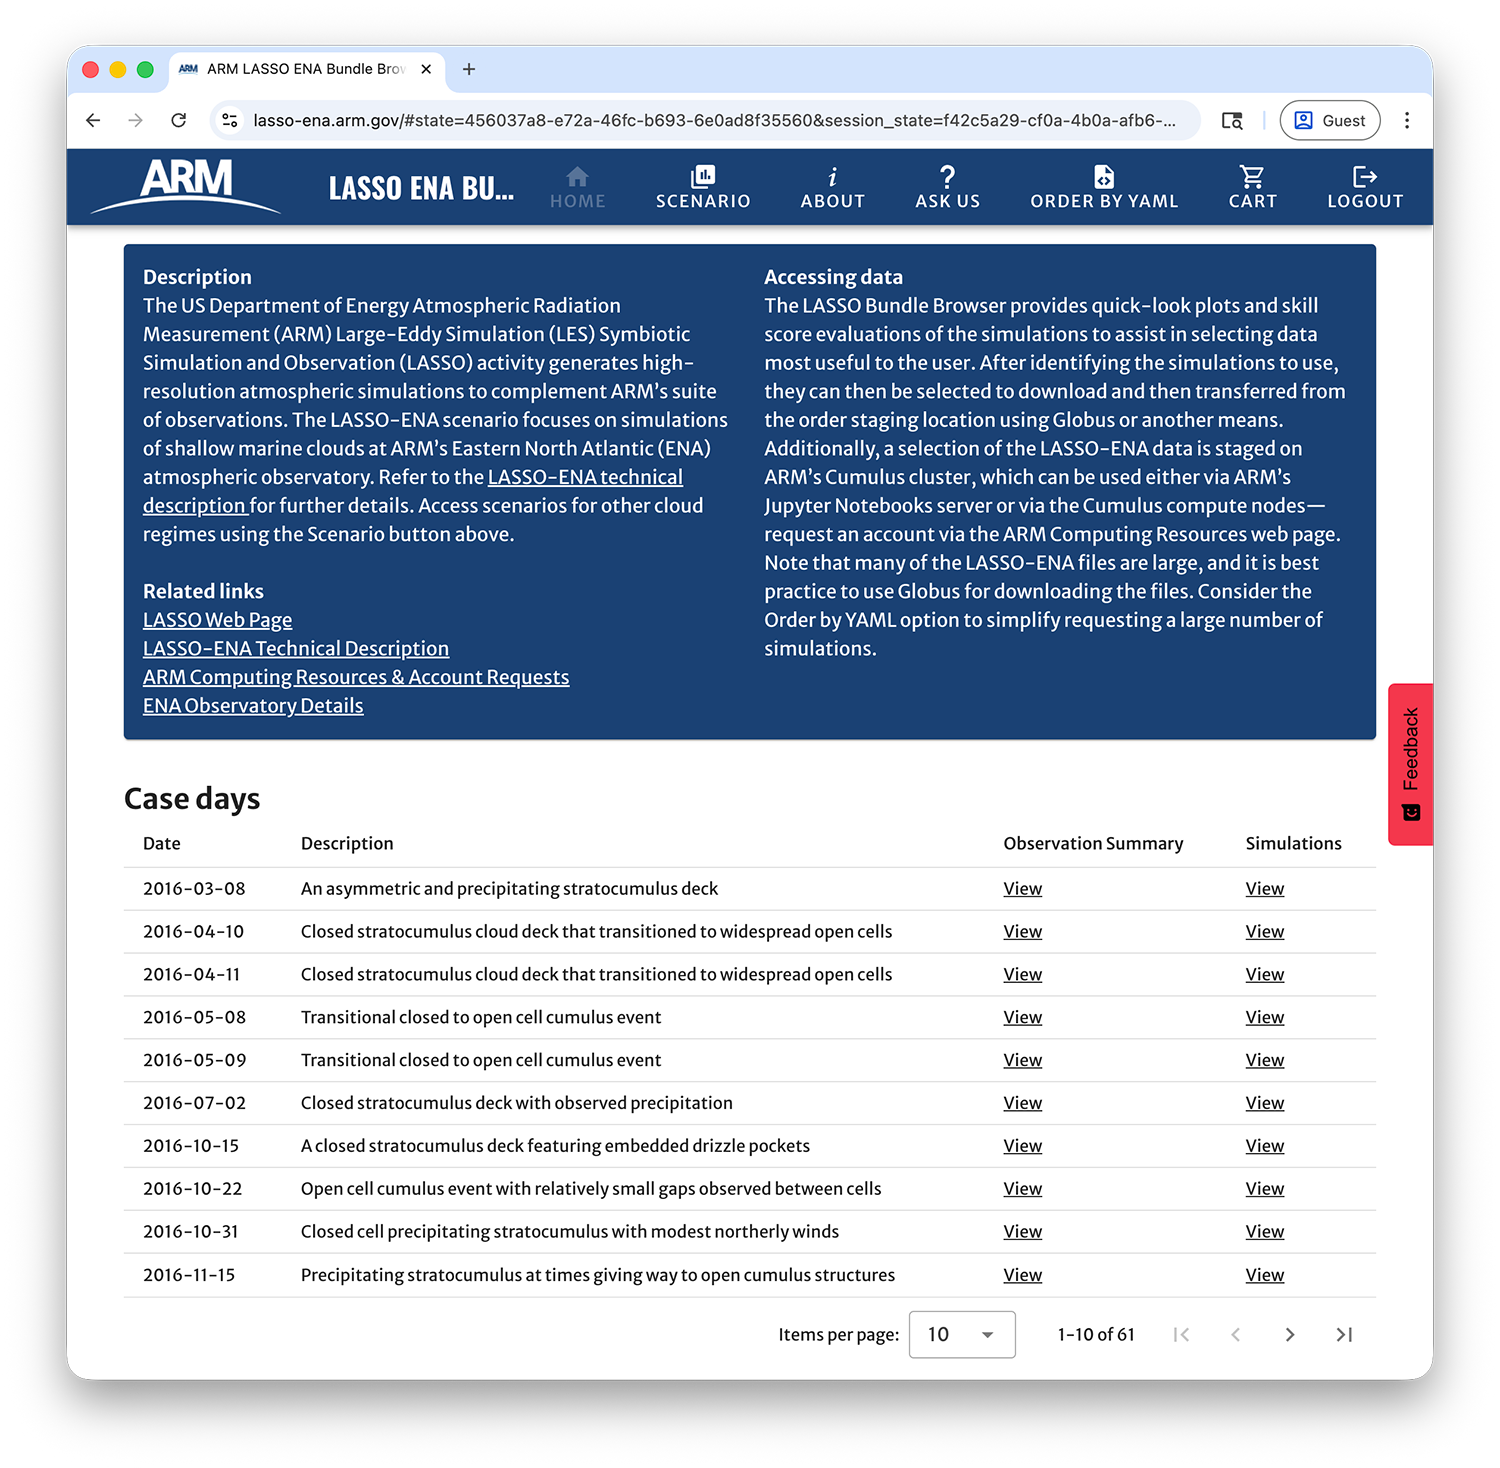
Figure 70 Home page for the LASSO-ENA Bundle Browser.
The header icons at the top of the page are consistent throughout the browser. These icons allow you to return to the home page, switch to other LASSO scenario browsers, obtain more information about LASSO, submit a question to ARM staff, use the YAML order functionality, and access your order cart.
Observation Summary Pages
Observation summary pages are where to go to learn more about the meteorology and cloud conditions for each case. The pages present a selection of ARM and third party data based on what is available for the date.
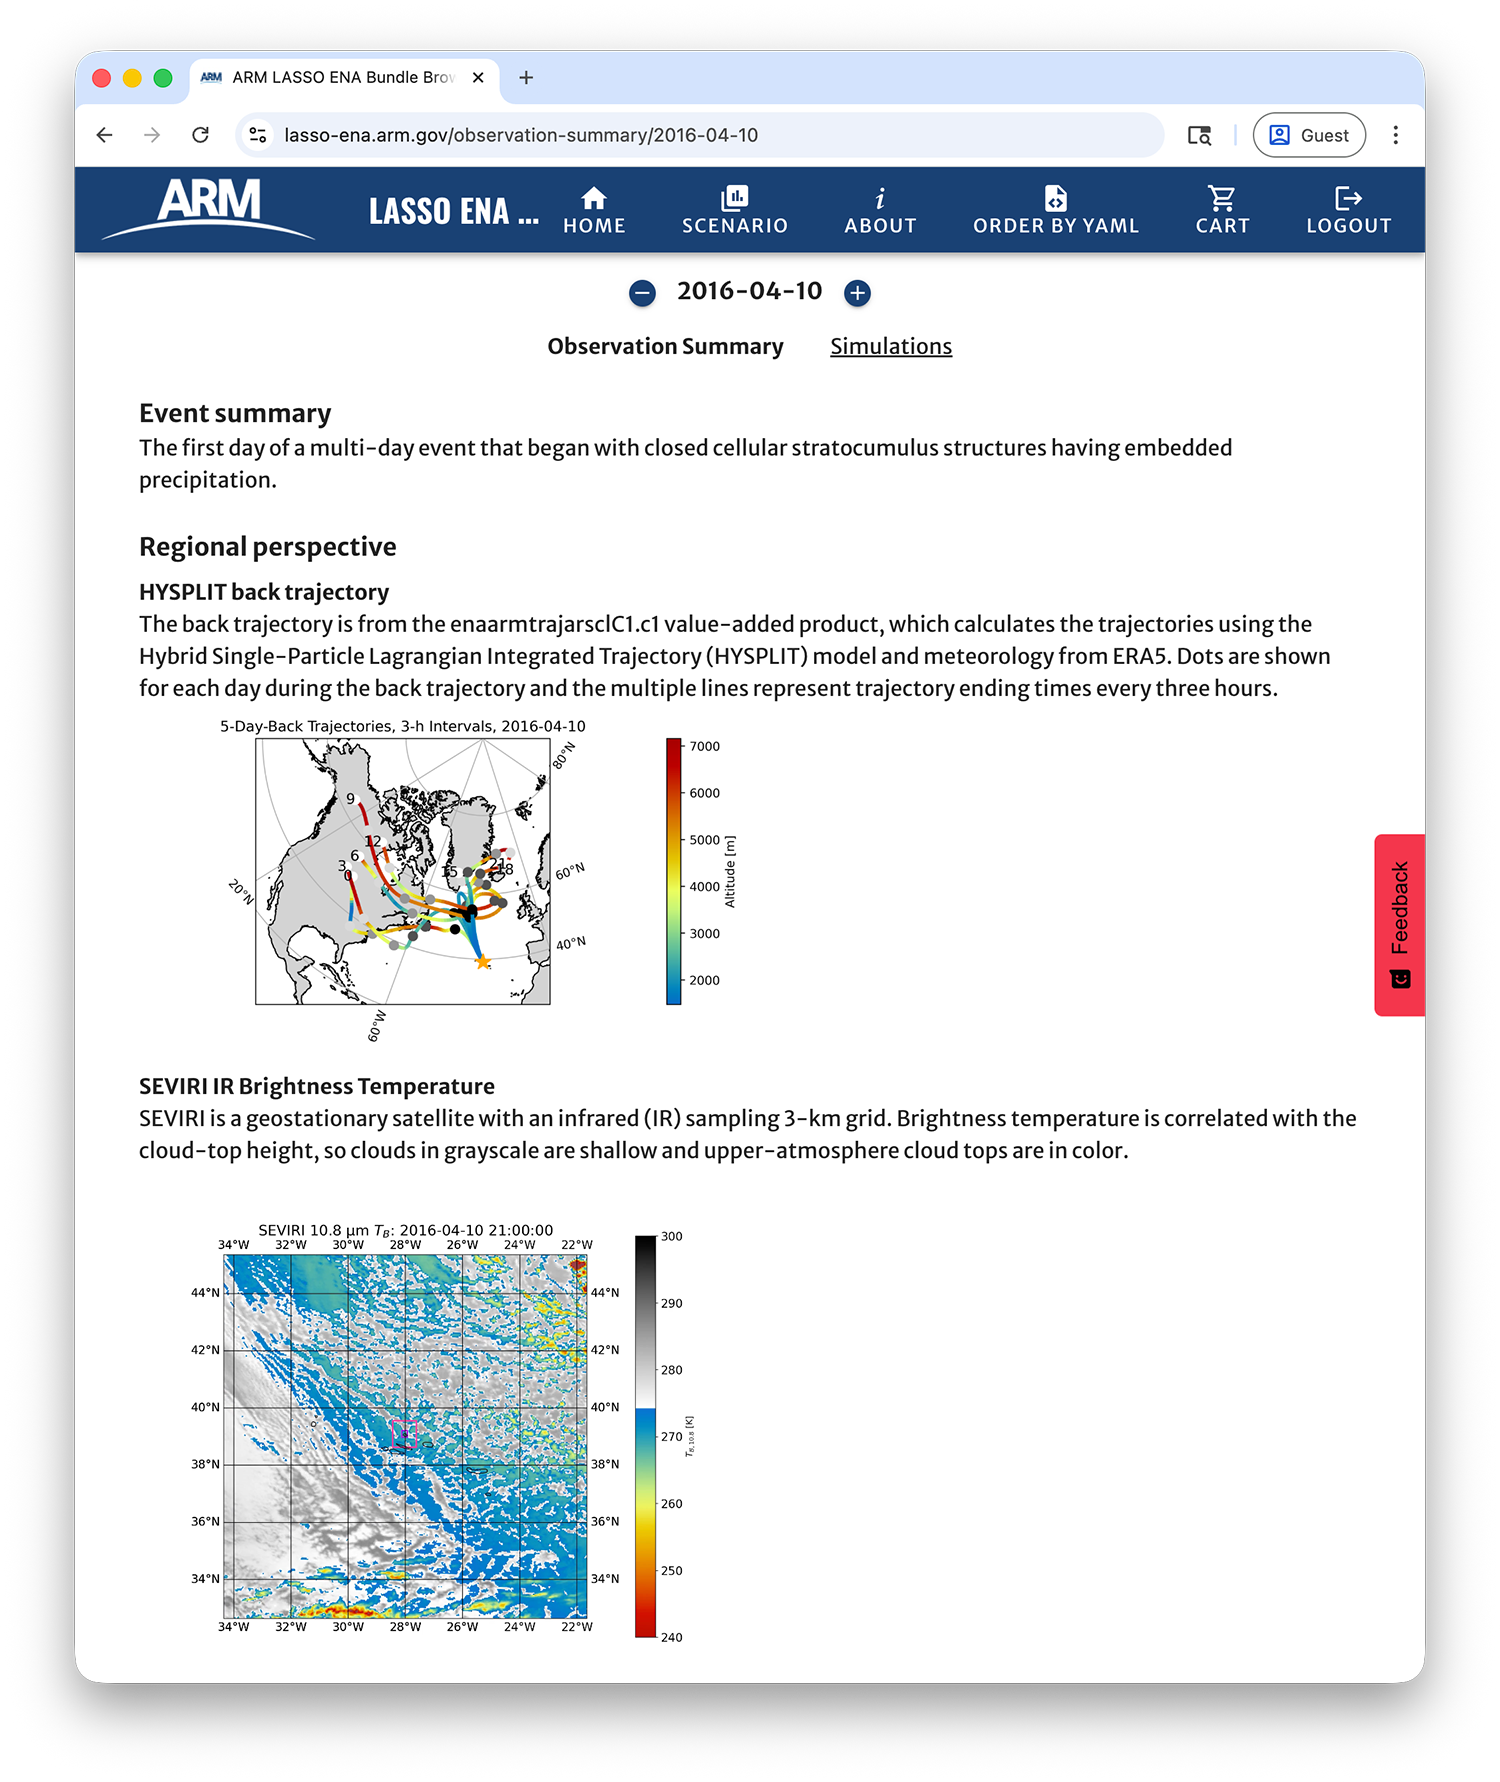
Figure 71 Observation summary page for the 10-Apr-2016 case.
The observations start with a regional perspective to provide the larger context for the day. First, is a back trajectory plot based on the enaarmtrajarsclC1 VAP [Silber et al., 2025]. The multi-day back trajectories are shown for trajectories whose end locations are the cloud base at ENA. Different trajectories are shown for end times every three hours during the case date. This provides a history of the air parcels crossing over ENA throughout the day. The next set of plots are an animation of infrared brightness temperature from the SEVIRI satellite and MODIS snapshots from Terra (~11 UTC) and Aqua (~13 UTC) overpasses [Minnis et al., 2008, Minnis et al., 2021, Trepte et al., 2019].
The remainder of the page provides the local perspective from the main ENA location. There are time-height plots of ARSCL-KAZR reflectivity [Clothiaux et al., 2001], ARSCL Doppler vertical-wind velocity, and radar profiler winds [Muradyan and Coulter, 2020]. Time series are provided for liquid water path (TROPoe or MWRRET); cloud optical depth froom the sun photometer; cloud fraction derived from multiple measurement techniques (SEVIRI, TSI, ARSCL, and ceilometer); surface temperature, dew point, and pressure from the MET product; and CCN from the CCN counter via enaaosccn1colspectraC1 plotted alongside CDNC from the MFRSR via enandropmfrsrC1. Soundings from radiosondes are generally available every 12 hours, with some days having more frequent launches. Aerosol information includes a “banana plot” for the aerosol size spectrum and a daily average of the aerosol size distribution, both as measured by the UHSAS.
Simulations Pages
Each case date has a page dedicated to its respective simulations, which is accessed either from the table of cases on the home page or the “simulations” link at the top of the corresponding observations page. The top of the simulations page conveys a summary of the simulation skill socres for the case date, and the bottom of the page has a table listing the simulations along with the ability to queue them for ordering.
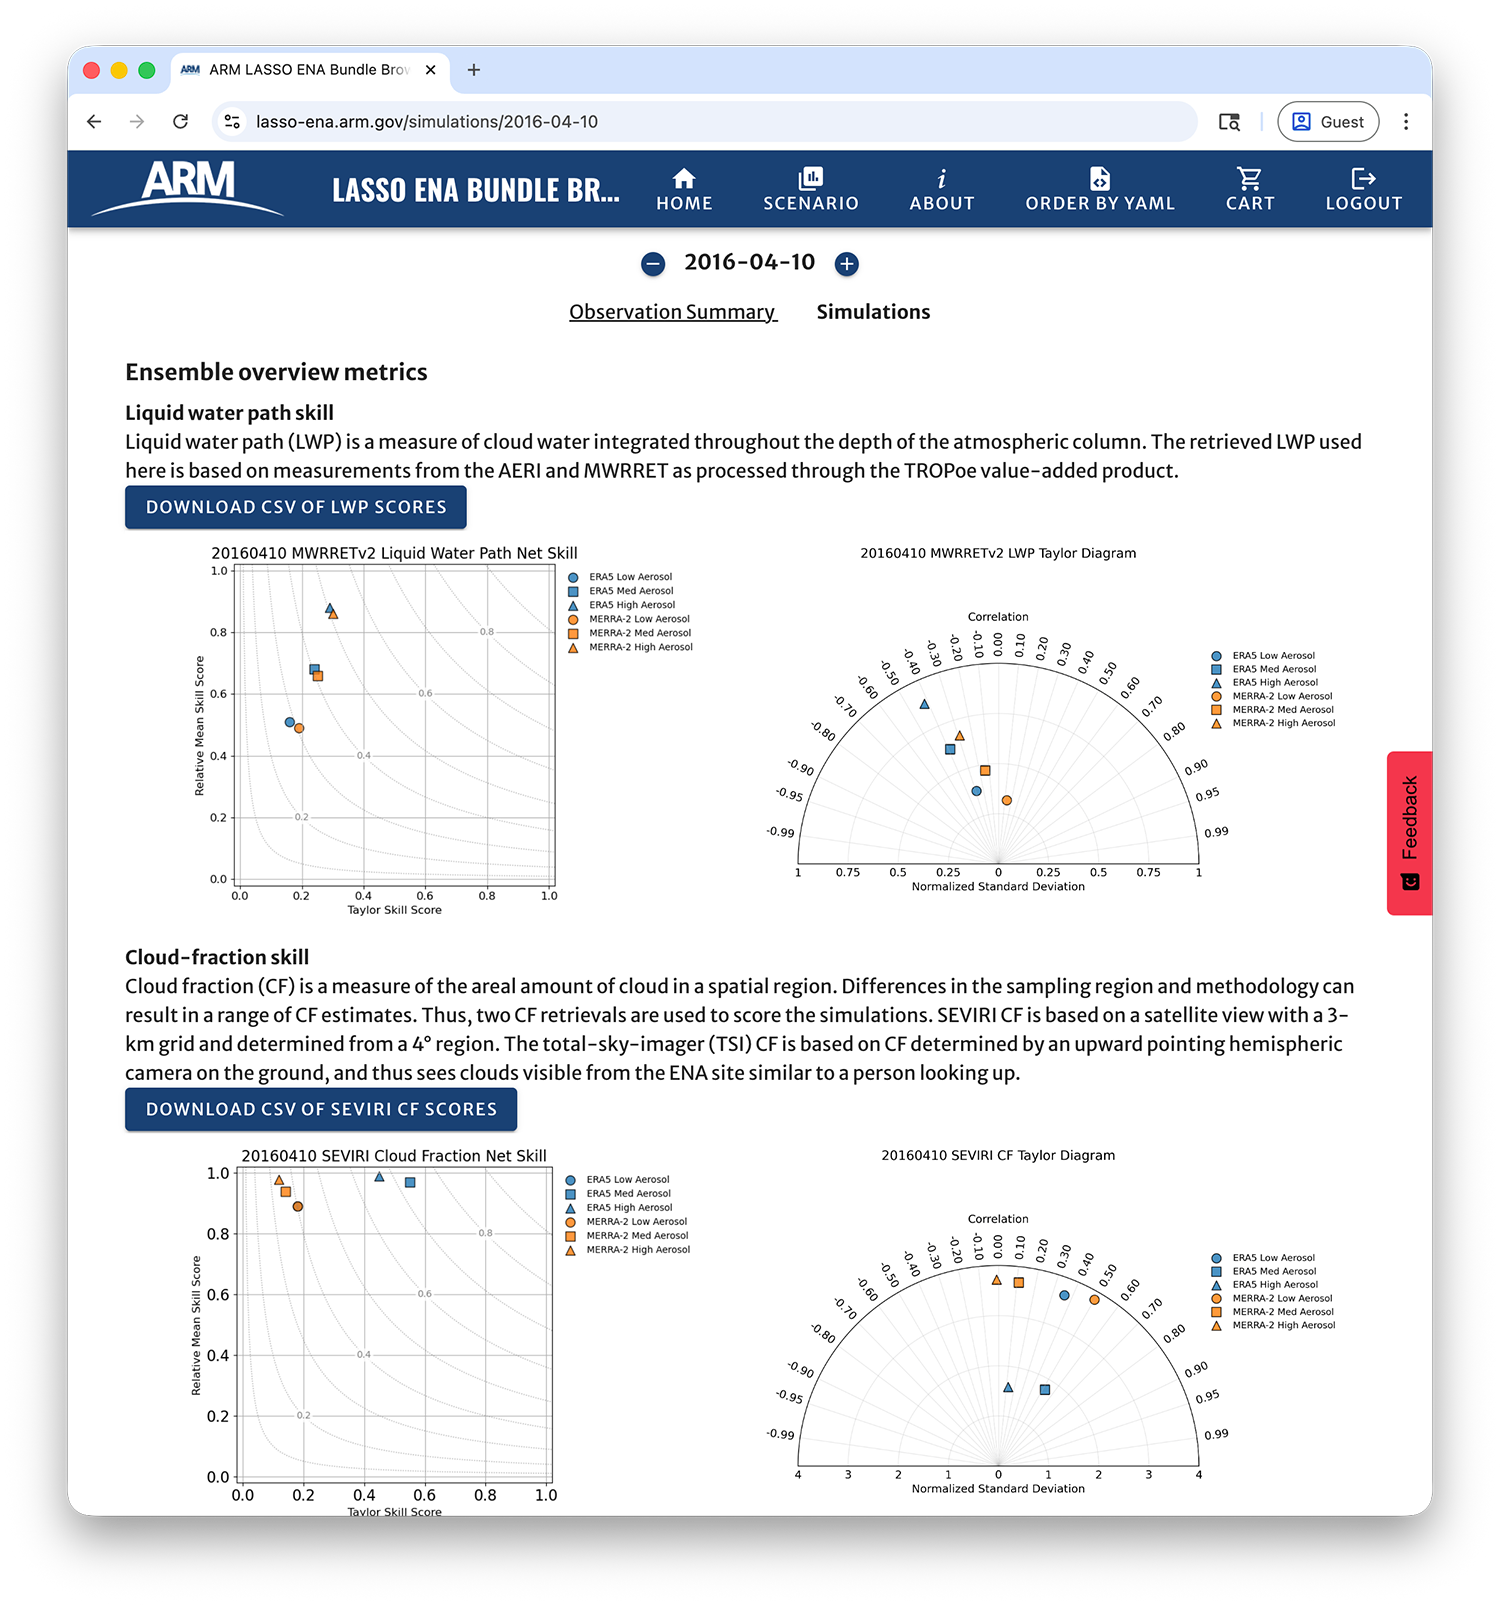
Figure 72 The top portion of the simulations webpage for 10-Apr-2016 case showing some of the skill score plots that compare simulation behavior for this case date.
The top of the simulation page (Figure 72) has summary information comparing the behavior of the simulations for the case date using the skill scores described in the Observations and Skill Scores section. This is useful to identify how the different forcing data sets impact simulations for the given day, as well as for comparing cloud behavior between different aerosol concentrations. The skill scores shown in the plots can be downloaded in CSV format using the blue buttons in each section of the scores, which are for liquid water path, cloud fraction from SEVIRI, and cloud fraction from the TSI.
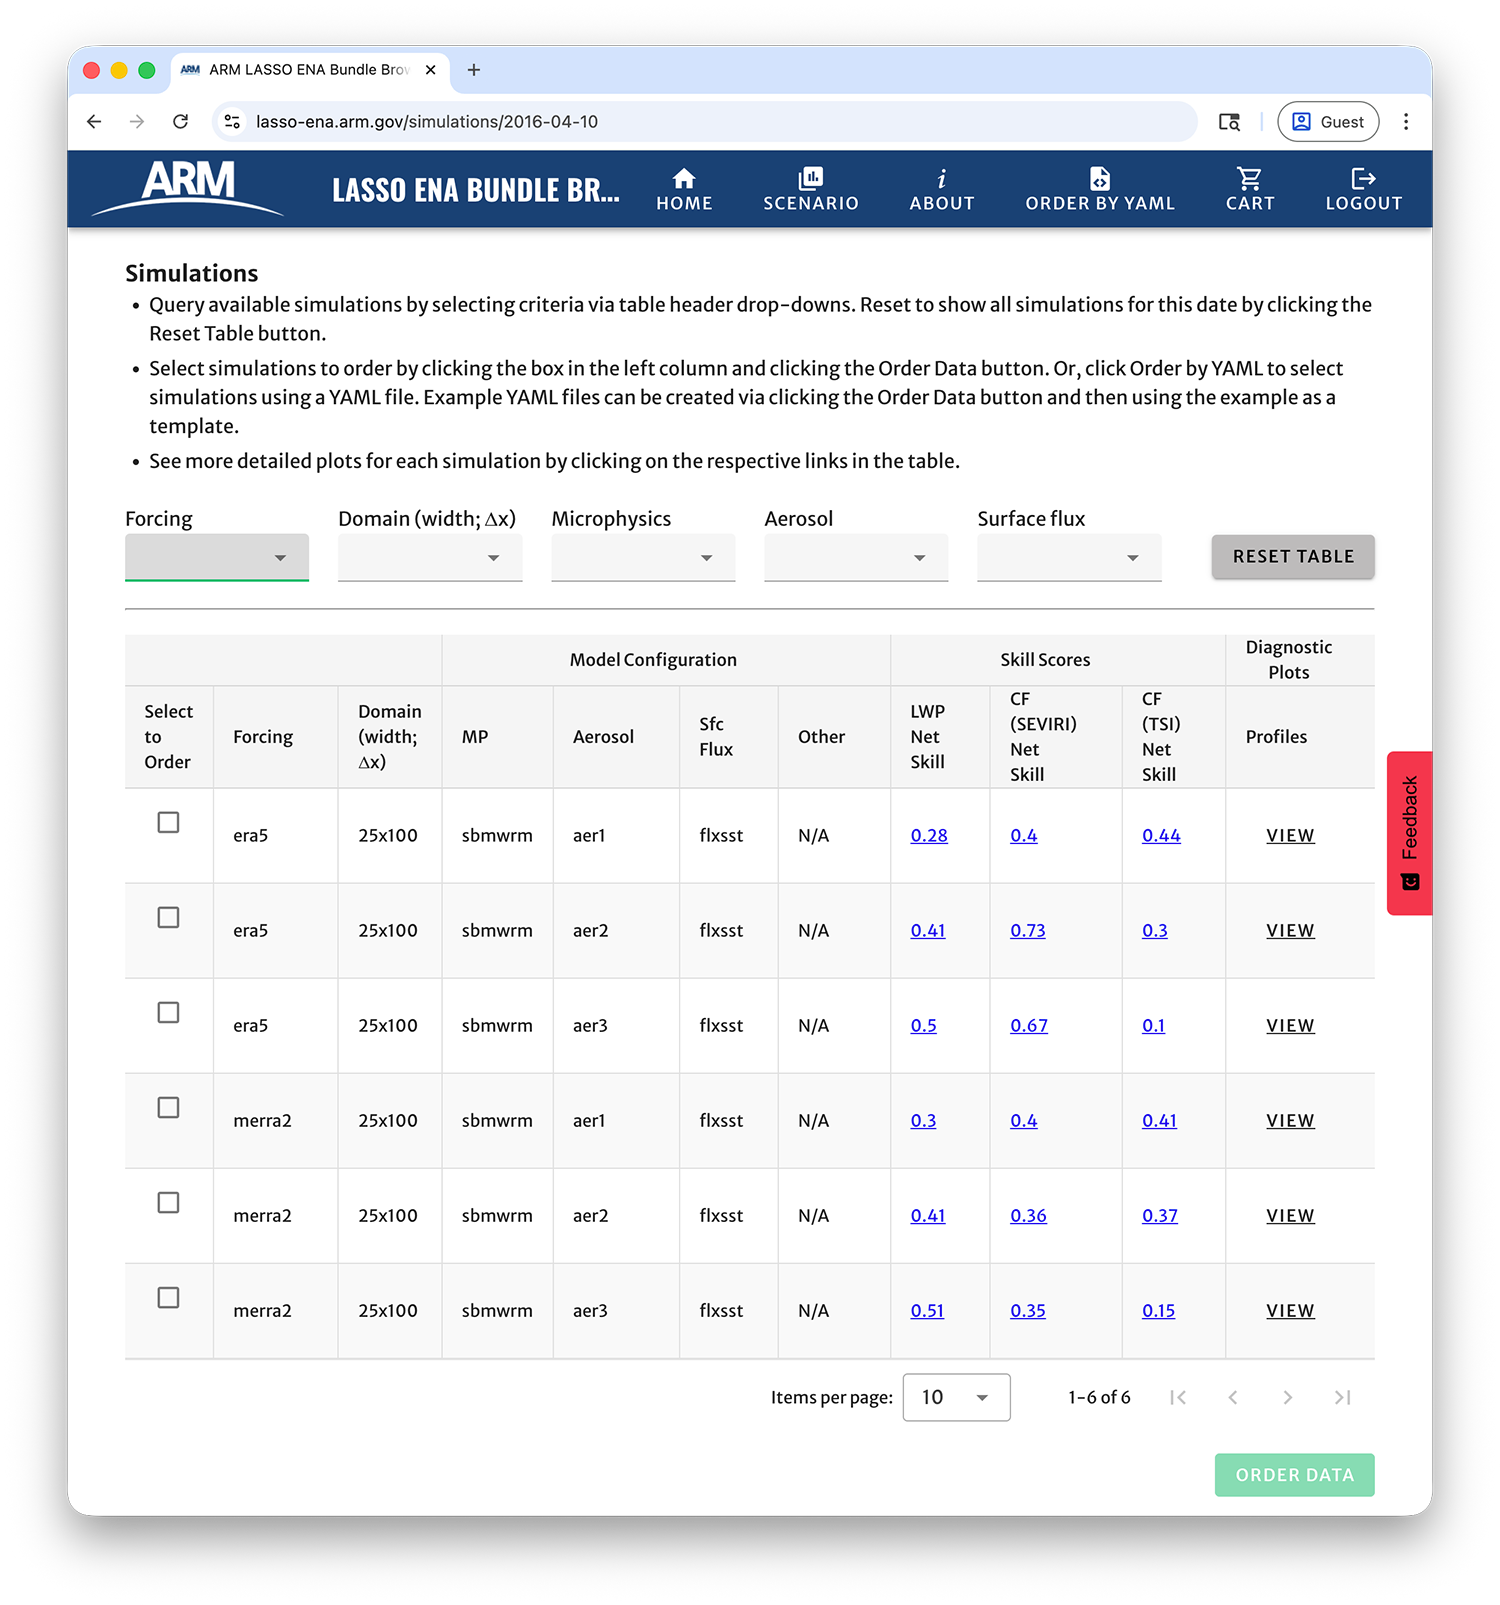
Figure 73 The bottom portion of the simulations webpage for 10-Apr-2016 case showing the table of simulations used to order simulation data.
Scrolling to the bottom of the simulations page, as shown in Figure 73, one sees the table of simulations available for the case date. The drop-down menus along the top of the table will filter the results based on the primary simulation metadata: forcing data set, domain size, microphysics parameterization, aerosol concentration, and surface flux methodology. Additional plots can be viewed by clicking ono links in the table. The underlying time series used to calculate the LWP and CF scores are shown when clicking on the scores. Additionally, sounding profiles can be accessed via the respective table column.
Ordering Simulation Data
The leftmost column of the simulation table (Figure 73) has checkboxes for ordering simulation data. Clicking these boxes chooses which simulations to order, and then clicking the green Order Data button at the bottom of the screen brings up a dialog box for identifying which file types to place in the user’s cart (Figure 74). The top-left column lists available file types, which are described in the File Types section. Some files, such as the domain-wide statistics cotains data for the entire simulation period. Others, such as the 3-D files, contain one output time per file. The first and last time in the time series of these more granular files can be selected using the time selectors in the right-hand column. The resulting file list generates in the bottom of the dialog box.
Note the size of the order being placed so that you do not overwhelm where you will be downloading the data. Ordering more data than necessary will also slow the order down since the data typically resides on tape, which is slow to copy over to spinning drives when staging for your download. Click the green Add to Cart button once your are satisfied with your selections.
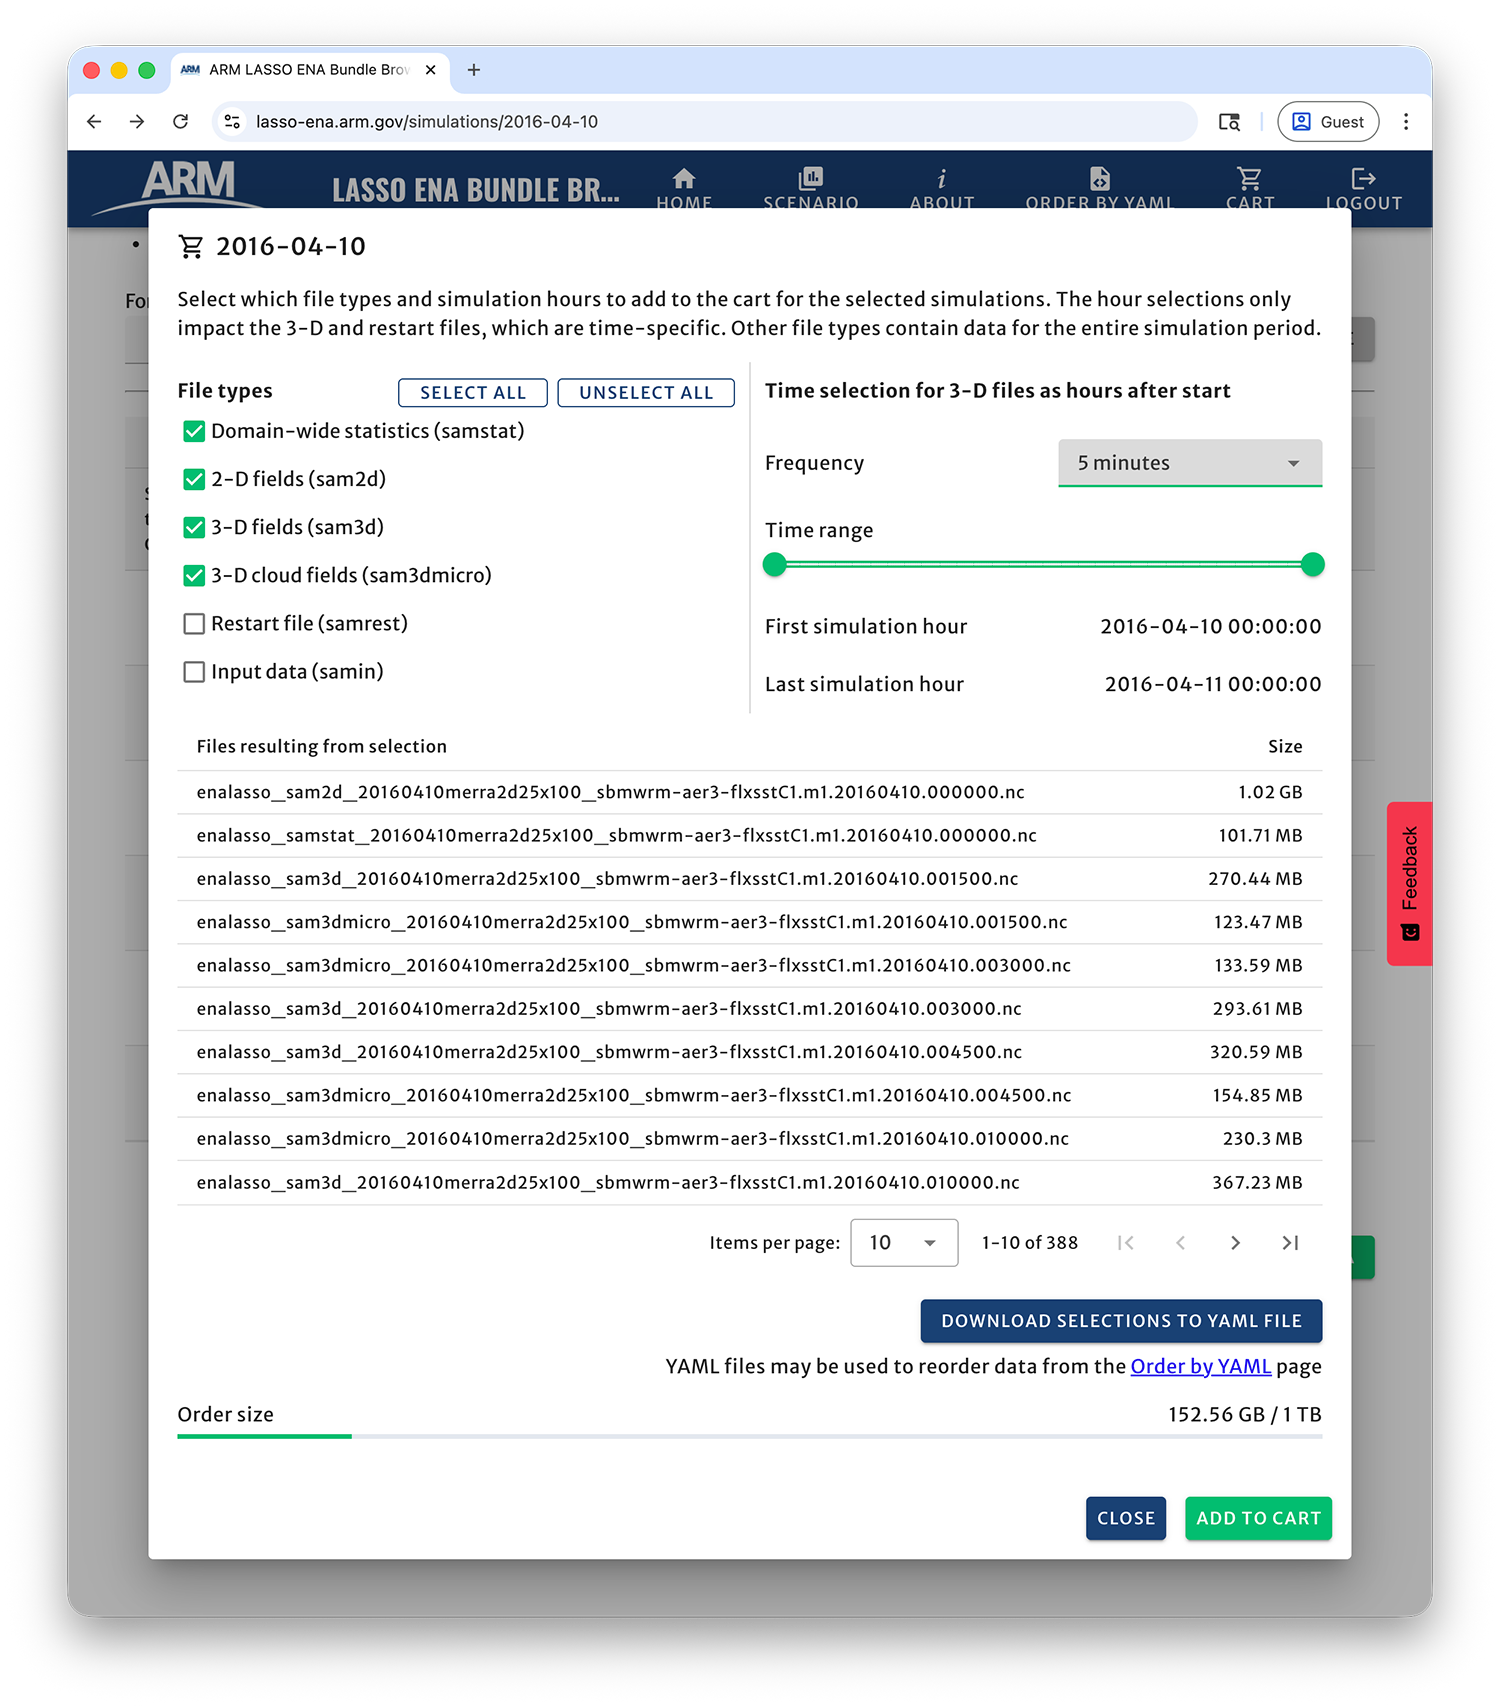
Figure 74 The dialog box that pops up when clicking the green Order Data button. Use this box to select which file types to order for the simulations chosen from the simulation table.
Ordering Simulations via YAML Files
Also within the file selection dialog box (Figure 74), note the button to Download Selections to YAML File that can be used to reproduce your order. The resulting YAML file documents your order for later reproducibility and also can be used as a template to order similar files for alternate case dates.
An example YAML corresponding to the selections in Figure 74 looks like:
- simulations:
    - case_date: '2016-04-10T00:00:00'
      forcing: merra2
      domain: 25x100
      microphysics: sbmwrm
      aerosol: aer3
      surface_flux: flxsst
    - case_date: '2016-04-10T00:00:00'
      forcing: era5
      domain: 25x100
      microphysics: sbmwrm
      aerosol: aer3
      surface_flux: flxsst
  file_types:
    - samstat
    - sam2d
    - sam3d
    - sam3dmicro
  start_date: '2016-04-10T00:00:00.000Z'
  end_date: '2016-04-11T00:00:00.000Z'
  frequency: 5
Modifying the YAML file to select alternate dates or desired files is simple and can be done either manually or via scripting for more extensive requests. The resulting YAMLs can be used with the Order by YAML webpage (Figure 75), which can be accessed via the icon in the top header of any page in the browser. Figure 75 shows an example where a YAML file has been uploaded and the files corresponding to the requested metadata populate the lower table. If these are correct, clicking the Add Items to Cart button to stages the files in the cart for downloading. Note that the order is not placed until the cart is submitted.
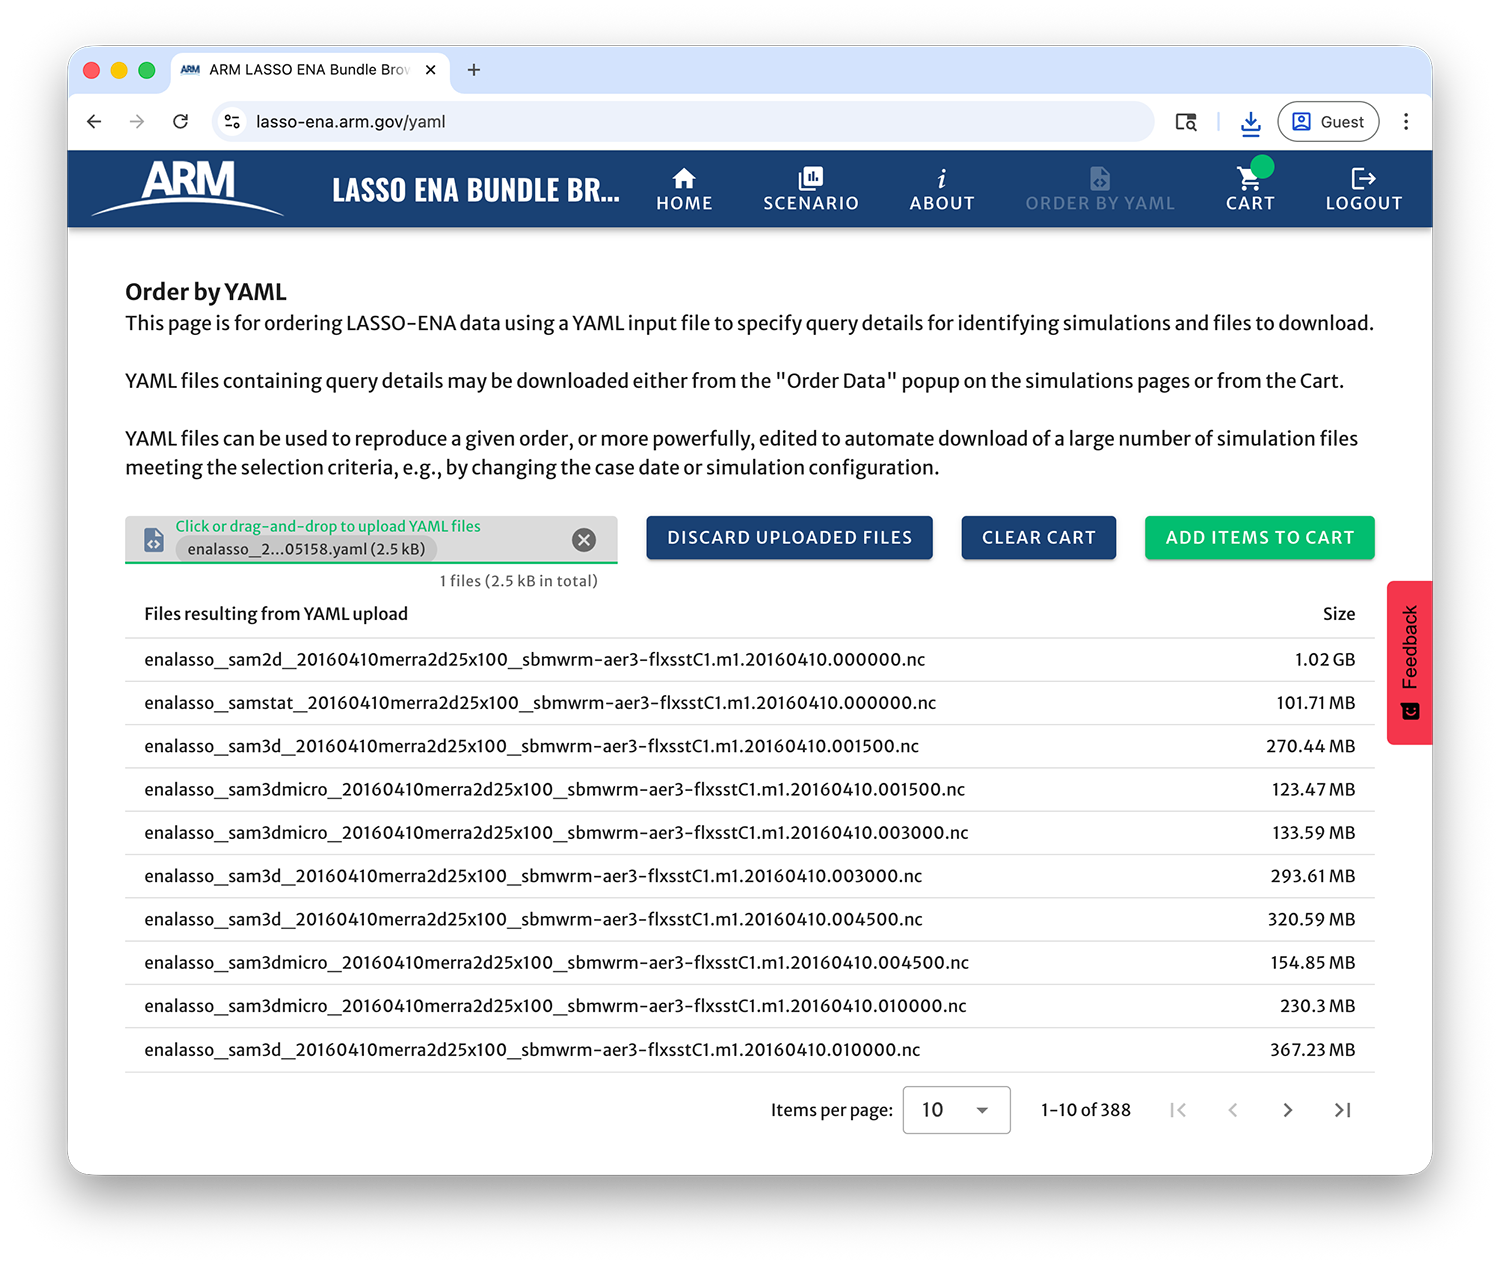
Figure 75 The Order by YAML webpage provides an interface that facilitates large and/or complicated data orders by using YAML files to select files to order. As shown, a YAML file has been uploaded and the resulting files are listed based on the desired metadata.
Placing an Order
Once files are placed in the user’s cart, either via manual selection or with a YAML request, they can be reviewed and must be submitted for the actual order request to begin. Selecting the Cart icon from the header row shows the user’s cart and its current contents. Depending on the user’s prior activity, the cart could contain files staged during a prior session in addition to any files selected during the current session. Figure 76 shows an example cart with files staged from the above YAML file. Users can remove any mistakenly requested files using the trashcan icons in the right-hand column. The Download Selections to YAML File will download a YAML file that can be used to reproduce the order, simliar to the button in the file selection dialog box (Figure 74).
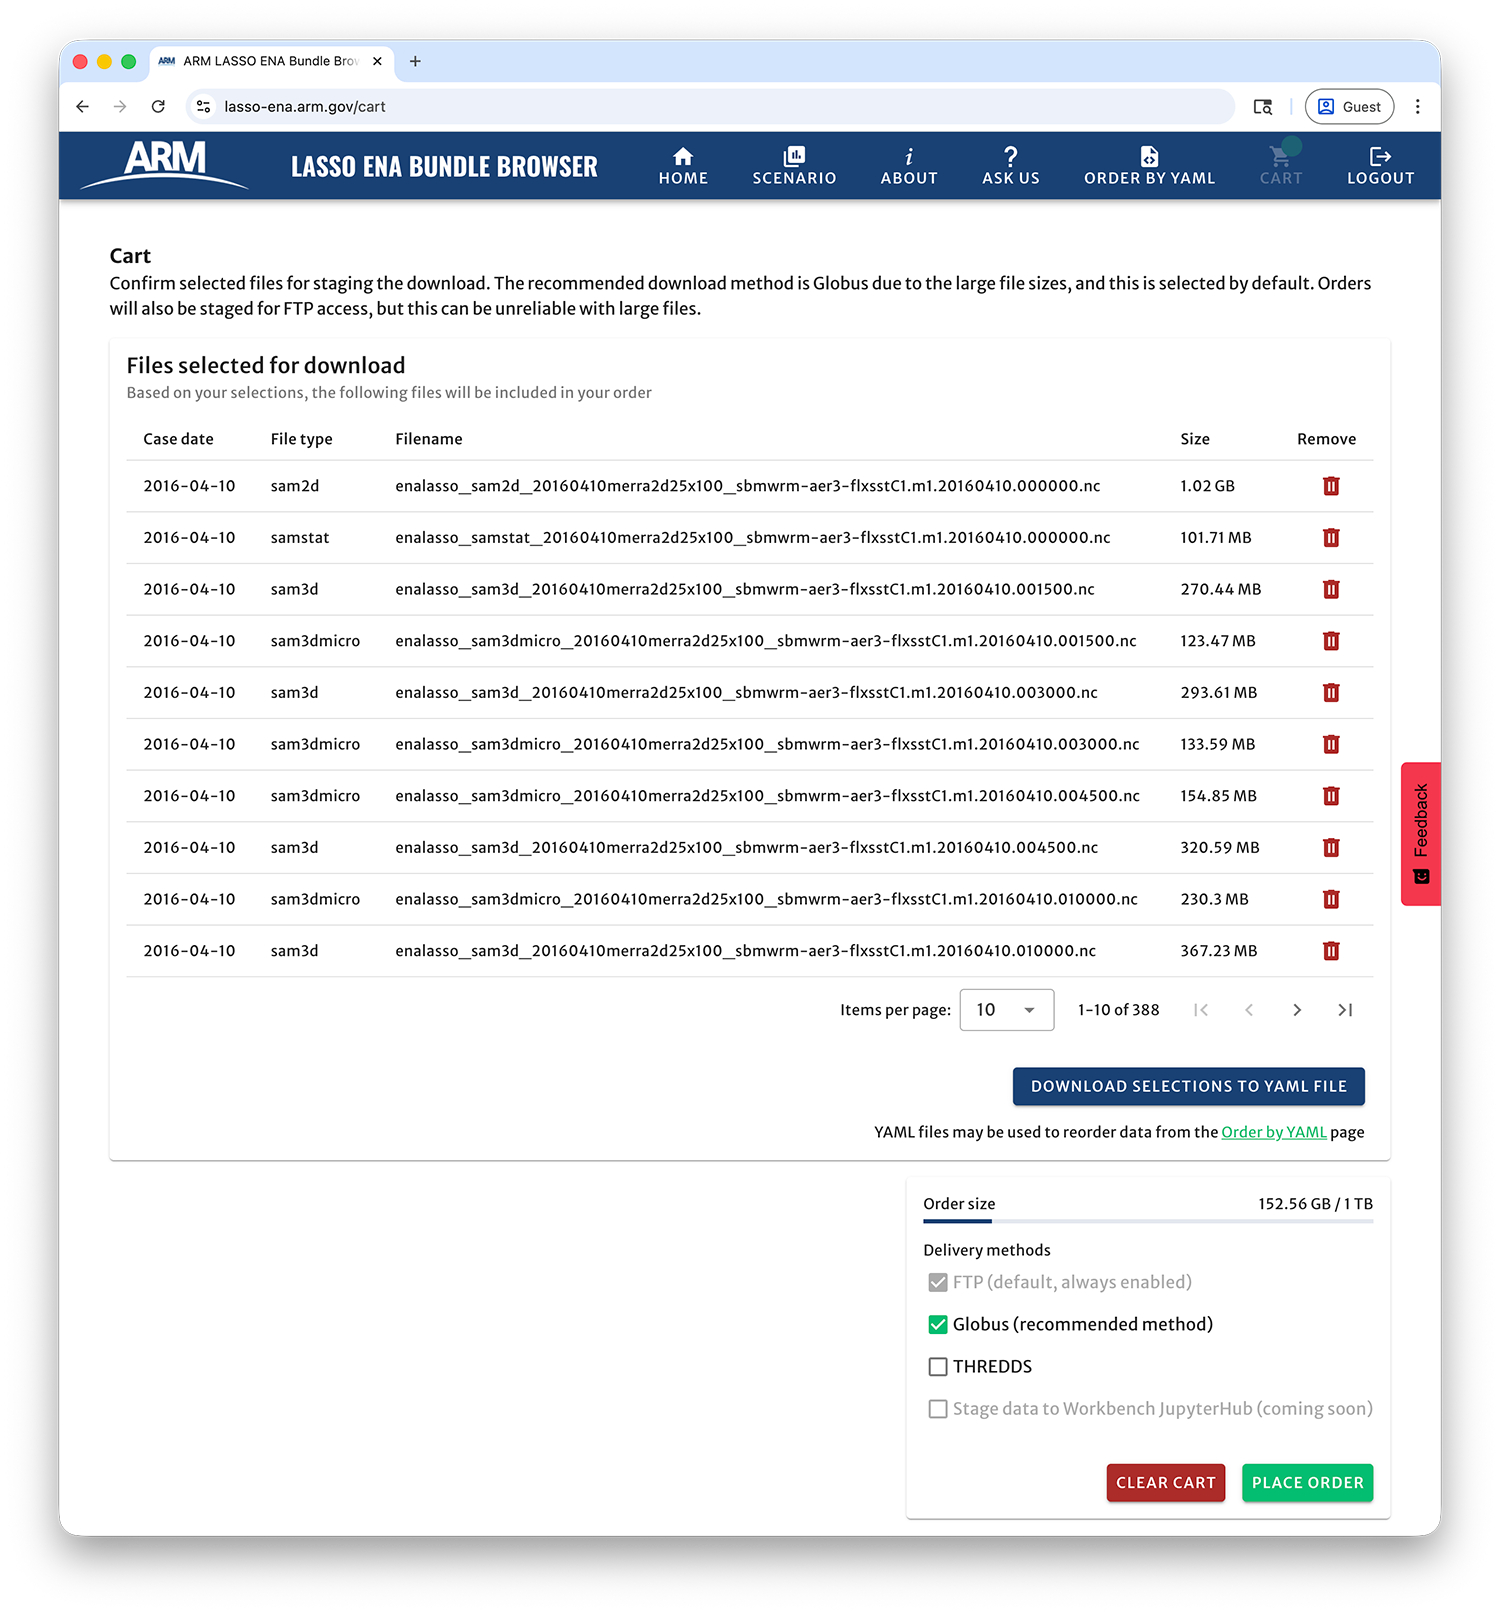
Figure 76 The user cart shows files that will be staged once the order is placed. The listed files will be staged for user download once the order is placed.
ARM provides multiple ways to receive ordered files, which can be chosen by checking the relevant boxes in the cart. Once an order is placed, files not already present in the order system’s disk buffer are copied from tape onto the buffer for user access. Staged files are always accessible using FTP, but this method can be unreliable for downloading large files, such as those associated with LASSO model simulations. Alternatively, Globus can be used, and it is highly recommended that users utilize Globus to copy files whenever possible. Globus provides a more user friendly, reliable, and quick way to retrieve the staged files. For example, failed downloads are automatically reattempted and parallel transfers can take avantage of high-speed disk systems common at research computing facilities. More information can be found at https://www.globus.org/. THREDDS is a third option that enables interactive data access using a client-server mentality. It can be useful in situations where only a small portion of data within a file is needed.
Remember that the order is not placed until the green Place Order button is clicked (Figure 76). That will trigger file staging to disk from tape, and an email will be sent once the files are ready to download. An order number is shown just after placing the order—it is helpful to note this number in case you need to contact ARM regarding the order. The time to recieve the files will vary depending on whether the file(s) are already cached on spinning drives, are contained on one tape versus spread across mutiple tapes, etc.
Users needing help with orders can send questions to adc@arm.gov by clicking the Ask Us button in the header, which opens a ticket with the ARM Data Center. The LASSO developers can also help in some cases, lasso@arm.gov. Reach out if an order has not arrived in a couple days for large orders, as there might have been an issue with it. Small orders should arrive more quickly.